Short Answer
Provide an appropriate response.
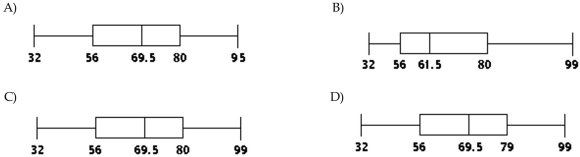
-The test scores of 32 students are listed below. Construct a boxplot for the data set.
Correct Answer:

Verified
Correct Answer:
Verified
Related Questions
Q46: Find the z-score corresponding to the given
Q47: Which of the following statements regarding
Q48: Find the midrange for the given sample
Q49: Find the percentile for the data
Q50: Find the median for the given
Q52: Provide an appropriate response.<br>-We want to compare
Q53: Find the range for the given
Q54: Determine which score corresponds to the higher
Q55: Find the range for the given
Q56: Find the standard deviation of the data