Not Answered
Provide an appropriate response.
-Describe any similarities or differences in the two distributions represented by the following boxplots. Assume the two boxplots have the same scale. 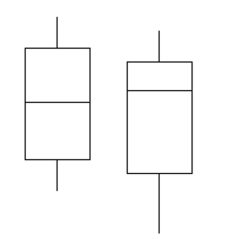
Correct Answer:

Verified
Correct Answer:
Verified
Related Questions
Q39: Solve the problem. Round results to the
Q40: Find the mode(s)for the given sample
Q41: Use the empirical rule to solve the
Q42: Find the range for the given
Q43: Solve the problem.<br>-The 10% trimmed mean of
Q45: Find the standard deviation of the data
Q46: Find the z-score corresponding to the given
Q47: Which of the following statements regarding
Q48: Find the midrange for the given sample
Q49: Find the percentile for the data