Multiple Choice
Use the circle graph to solve the problem.
-A survey of the 4960 vehicles on the campus of State University yielded the following pie chart. 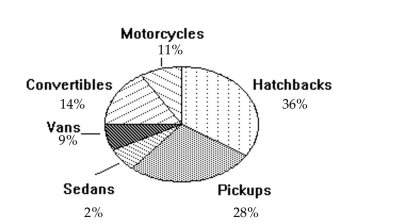 Together, what percent of the vehicles are either vans or convertibles?
A) 5%
B) 23%
C) 14%
D) 126%
Correct Answer:

Verified
Correct Answer:
Verified
Q37: Use the given data to construct
Q38: Solve the problem.<br>-Construct a frequency distribution and
Q39: Construct the relative frequency distribution that
Q40: Provide an appropriate response.<br>-Sturges' guideline suggests that
Q41: Construct a boxplot for the given
Q43: A nurse measured the blood pressure of
Q44: Solve the problem.<br>-The following frequency distribution
Q45: Construct the dot plot for the
Q46: A nurse measured the blood pressure of
Q47: Use the given data to construct