Multiple Choice
Use the circle graph to solve the problem.
-The pie chart below gives the number of students in the residence halls at the state university. 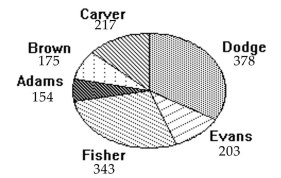
Write the ratio of the number of residents at Fisher to the number of students at Carver.
A)
B)
C)
D)
Correct Answer:

Verified
Correct Answer:
Verified
Q28: Solve the problem.<br>-The following frequency distribution
Q29: Construct a pie chart representing the
Q30: Solve the problem.<br>-The data shows the
Q31: Construct the relative frequency distribution that
Q32: Solve the problem.<br>-Using the employment information
Q34: Use the circle graph to solve the
Q35: Solve the problem.<br>-In a survey, 26
Q36: Solve the problem.<br>-Use the high closing
Q37: Use the given data to construct
Q38: Solve the problem.<br>-Construct a frequency distribution and