Multiple Choice
Solve the problem.
-At the National Criminologists Association's annual convention, participants filled out a questionnaire asking what they thought was the most important cause for criminal behavior. The tally was as follows. Make a Pareto chart to display these findings.
A) 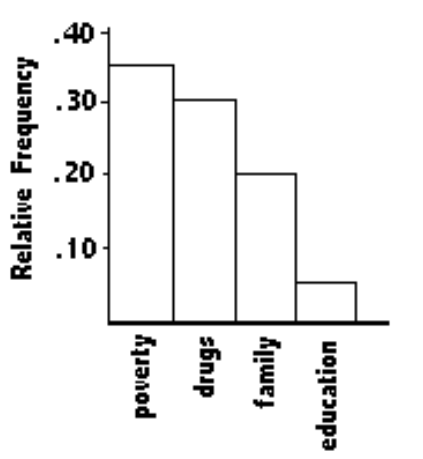
B) 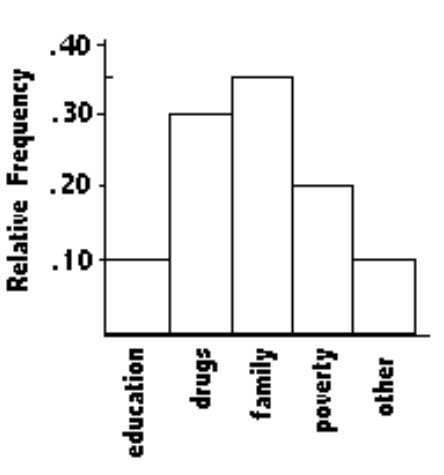
C) 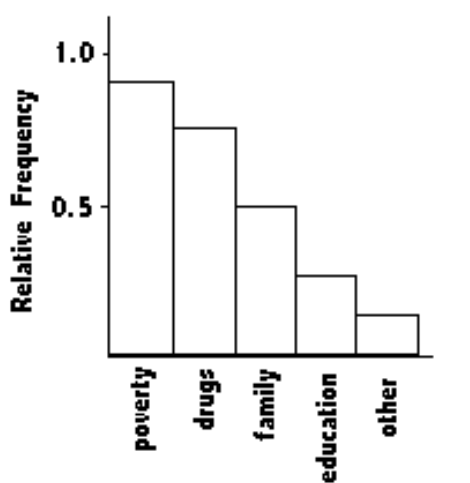
D) 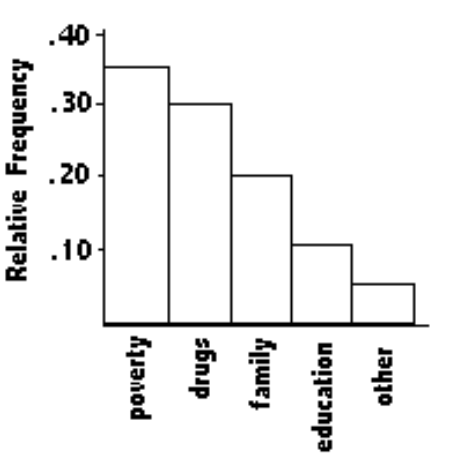
Correct Answer:

Verified
Correct Answer:
Verified
Q58: Provide an appropriate response.<br>-Create an example displaying
Q60: Construct a pie chart representing the
Q61: Find the original data from the
Q62: Use the circle graph to solve the
Q64: Construct a boxplot for the given
Q65: Construct the relative frequency distribution that
Q66: Explain the difference between a frequency distribution
Q66: Provide an appropriate response.<br>-Suppose that a data
Q67: Construct the dot plot for the
Q68: Construct the cumulative frequency distribution that