Essay
Use the given process data to construct a control chart for p
-A control chart for R is shown below. Determine whether the process variation is within statistical control. If it is not, identify which of the three out-of-control criteria lead to rejection of statistically stable variation. 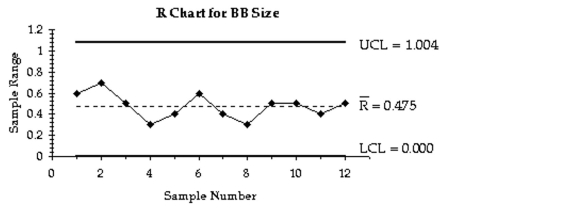
Correct Answer:

Verified
Process variation ap...View Answer
Unlock this answer now
Get Access to more Verified Answers free of charge
Correct Answer:
Verified
View Answer
Unlock this answer now
Get Access to more Verified Answers free of charge
Q21: Use the given process data to
Q22: Use the given process data to construct
Q23: Use the given process data to
Q24: Use the given process data to construct
Q26: Use the given process data to
Q28: Use the given process data to construct
Q29: Use the given process data to
Q30: Use the given process data to
Q46: Describe the three criteria used to determine
Q52: Describe a run chart and give an