Essay
Use the given process data to construct a control chart for p
-A run chart for individual values is shown below. Does there appear to be a pattern suggesting that the process is not within statistical control? If so, describe the pattern. 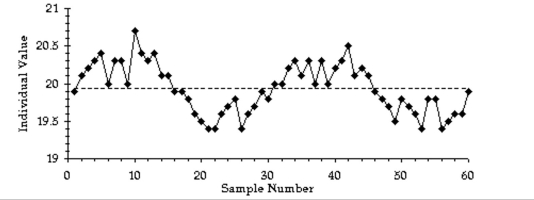
Correct Answer:

Verified
Process appears to b...View Answer
Unlock this answer now
Get Access to more Verified Answers free of charge
Correct Answer:
Verified
View Answer
Unlock this answer now
Get Access to more Verified Answers free of charge
Q10: Use the given process data to construct
Q11: Solve the Problem.<br>-A control chart for attributes
Q12: Use the given process data to construct
Q14: Use the given process data to
Q16: Use the given process data to
Q17: Use the given process data to
Q19: A machine is supposed to fill
Q32: Define statistically stable (or "within statistical control").
Q46: Describe the three criteria used to determine
Q50: A common goal of quality control is