Multiple Choice
The following scatterplot shows the percentage of the vote a candidate received in the 2004 senatorial elections according to the voter's income level based on an exit poll of voters
Conducted by CNN. The income levels 1 -8 correspond to the following income classes: Under -
150, or more.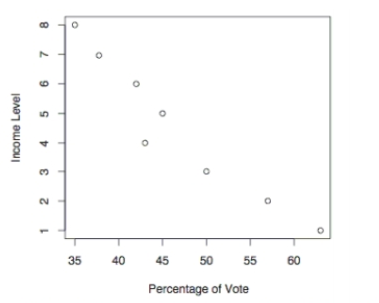
Use the election scatterplot to determine whether there is a correlation between percentage of vote and income level at the significance level with a null hypothesis of .
A) The test statistic is between the critical values, so we fail to reject the null hypothesis. There is no evidence to support a claim of correlation between percentage of vote and income level.
B) The test statistic is not between the critical values, so we fail to reject the null hypothesis. There is no evidence to support a claim of correlation between percentage of vote and income level.
C) The test statistic is between the critical values, so we reject the null hypothesis. There is sufficient evidence to support a claim of correlation between percentage of vote and income level.
D) The test statistic is not between the critical values, so we reject the null hypothesis. There is sufficient evidence to support a claim of correlation between percentage of vote and income level.
Correct Answer:

Verified
Correct Answer:
Verified
Q18: If test A has an efficiency rating
Q26: Define rank. Explain how to find the
Q142: The<br>values are given. Is there a
Q143: The data below represent the weight
Q145: The following data contains task completion
Q146: Test the claim that the samples
Q148: <span class="ql-formula" data-value="\text { Construct an }
Q149: Use a 0.05 level of significance
Q150: Use the sign test to test
Q151: Test the claim that the samples