Multiple Choice
The following scatterplot shows the percentage of the vote a candidate received in the 2004 senatorial elections according to the voter's income level based on an exit poll of voters
Conducted by CNN. The income levels 1 -8 correspond to the following income classes: Use the election scatterplot to the find the critical values corresponding to a significance level used to test the null hypothesis of .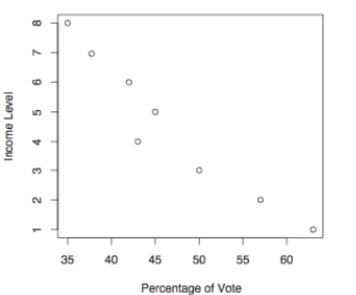
A) and
B)
C) and
D)
Correct Answer:

Verified
Correct Answer:
Verified
Q9: A control chart for attributes is to
Q18: List the assumptions for testing hypotheses that
Q21: Are control charts based on actual behavior
Q25: Which of the following is NOT a
Q37: Do parametric or nonparametric tests have higher
Q77: A standard aptitude test is given
Q79: Examine the given run chart or control
Q80: Use a Kruskal-Wallis test to test
Q86: Use the data in the given
Q87: Use the Minitab display to test