Multiple Choice
Construct a scatterplot for the given data.
A) 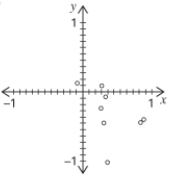
B) 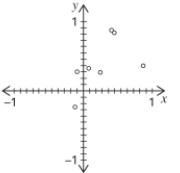
C) 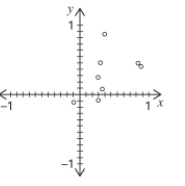
D) 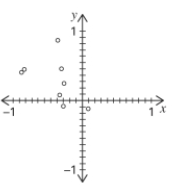
Correct Answer:

Verified
Correct Answer:
Verified
Related Questions
Q35: Use the given data to find
Q36: Use the given data to find
Q37: Suppose you will perform a test
Q41: Based on the scatterplot, select the
Q42: Suppose you will perform a test
Q43: Based on the scatterplot, select the
Q44: A <span class="ql-formula" data-value="0.01"><span class="katex"><span
Q48: Which of the following statements concerning the
Q52: Give an example of a pair of
Q55: Find the coefficient of determination, given that