Essay
The following table gives the US domestic oil production rates (excluding Alaska) from 1987 to 2002. A regression equation was fit to the data and the residual plot is shown below.
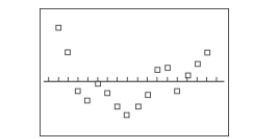
Does the residual plot suggest that the regression equation is a bad model? Why or why not?
Correct Answer:

Verified
Yes, the residual plot suggests that the...View Answer
Unlock this answer now
Get Access to more Verified Answers free of charge
Correct Answer:
Verified
Yes, the residual plot suggests that the...
View Answer
Unlock this answer now
Get Access to more Verified Answers free of charge
Related Questions
Q20: The residual is the _ the observed
Q27: Find the value of the linear
Q28: The following residual plot is obtained after
Q29: Give an example of a pair of
Q30: Suppose you will perform a test
Q31: Use the given data to find
Q35: Use the given data to find
Q36: Use the given data to find
Q37: Suppose you will perform a test
Q52: Give an example of a pair of