Multiple Choice
Find the indicated z score. The graph depicts the standard normal distribution with mean 0 and standard deviation 1. Shaded area is 0.4483. 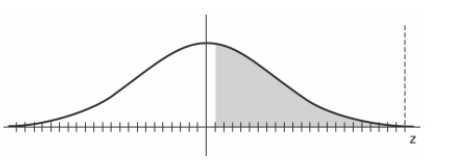
A)
B)
C)
D)
Correct Answer:

Verified
Correct Answer:
Verified
Related Questions
Q1: A bank's loan officer rates applicants for
Q3: A normal quartile plot is given below
Q5: Using the following uniform density curve, answer
Q7: The heights of adult females are normally
Q9: Scores on a test have a
Q11: <span class="ql-formula" data-value="\text { If } z
Q12: Define a density curve and describe the
Q29: Heights of adult females are normally distributed.
Q38: If a histogram of a sample of
Q47: Describe what an unbiased estimator is and