Essay
A normal quartile plot is given below for the weekly incomes (in dollars)of a sample of
engineers in one town. Describe what each x value represents and what each y value
represents. Use the plot to assess the normality of the incomes of engineers in this town.
Explain your reasoning. 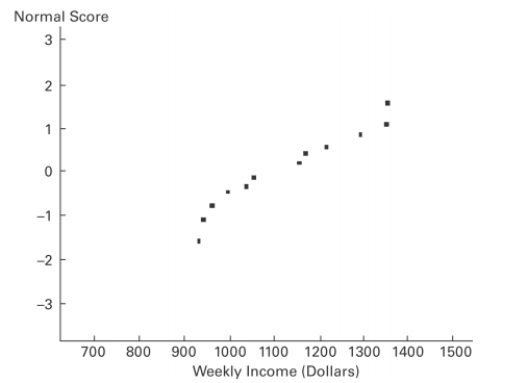
Correct Answer:

Verified
Each x-value is from the original set of...View Answer
Unlock this answer now
Get Access to more Verified Answers free of charge
Correct Answer:
Verified
View Answer
Unlock this answer now
Get Access to more Verified Answers free of charge
Q3: Define the central limit theorem and its
Q7: Estimate the indicated probability by using the
Q20: The given values are discrete. Use the
Q26: Three randomly selected households are surveyed as
Q30: Explain how a nonstandard normal distribution differs
Q32: After constructing a new manufacturing machine, five
Q34: For women aged 18-24, systolic blood pressures
Q54: For the binomial distribution with n=24
Q54: Assume that the red blood cell counts
Q55: The weights of college football players are