Short Answer
Describe any similarities or differences in the two distributions represented by the following
boxplots. Assume the two boxplots have the same scale. 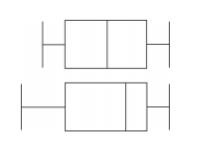
Correct Answer:

Verified
Correct Answer:
Verified
Related Questions
Q11: Which do you think has less variation:
Q15: If the standard deviation for a set
Q24: Find the standard deviation for the
Q27: Listed below are the amounts of
Q28: Scores on the SAT test have a
Q29: A comparison is made between summer
Q31: The test scores of 40 students
Q32: Last year, nine employees of an
Q35: Human body temperatures have a mean of
Q57: Scores on a test have a mean