Multiple Choice
A manufacturer records the number of errors each work station makes during the week. The data are as follows.
Which of these choices display the correct dotplot?
A) Number of Errors for the Week
B) Number of Errors for the Week for Workstations for Workstations
C) Number of Errors for the Week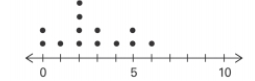
D) Number of Errors for the Week for Workstations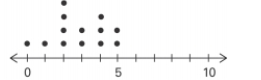
Correct Answer:

Verified
Correct Answer:
Verified
Q20: The following data set represents Heather's
Q21: The following data consists of the
Q22: The following frequency distribution depicts the
Q23: The following frequency distribution analyzes the
Q24: Identify the cumulative frequency distribution that
Q26: Analysis of the data from 25
Q27: The data shows the roundtrip mileage
Q28: Analysis of the data from 25
Q29: Identify the cumulative frequency distribution that
Q30: A store manager counts the number