Multiple Choice
FIGURE 7-5 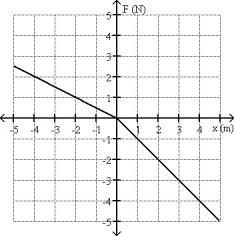
-The graph of a force as a function of position is shown in Fig. 7-5. Determine the amount of work done by this force for an object during a displacement from x = -2.00 m to x = 2.00 m.
A) -12.00 J
B) -3.00 J
C) -1.00 J
D) 12.00 J
E) 3.00 J
Correct Answer:

Verified
Correct Answer:
Verified
Q16: If the net work done on an
Q19: FIGURE 7-2 <img src="https://d2lvgg3v3hfg70.cloudfront.net/TB3817/.jpg" alt="FIGURE 7-2
Q20: FIGURE 7-1 <img src="https://d2lvgg3v3hfg70.cloudfront.net/TB3817/.jpg" alt="FIGURE 7-1
Q22: FIGURE 7-2 <img src="https://d2lvgg3v3hfg70.cloudfront.net/TB3817/.jpg" alt="FIGURE 7-2
Q23: Determine the scalar product of <img src="https://d2lvgg3v3hfg70.cloudfront.net/TB3817/.jpg"
Q24: An unusual spring has a restoring force
Q25: A force is dependent on position and
Q26: A net force exerted on an object
Q58: How large a force is required to
Q72: If you push twice as hard against