Multiple Choice
FIGURE 2-3 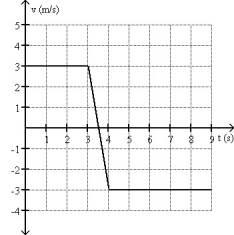
-Fig. 2-3 shows the velocity of an object as a function of time. Which graph best represents the acceleration as a function of time?
A) 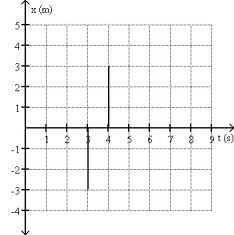
B) 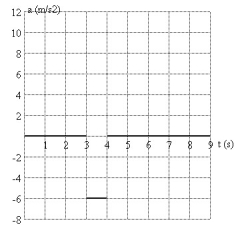
C) 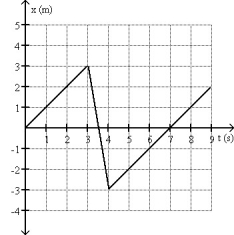
D) 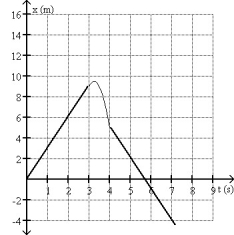
E) none of the above
Correct Answer:

Verified
Correct Answer:
Verified
Q12: A man walks south at a speed
Q15: An object is thrown upwards with a
Q16: FIGURE 2-6 <img src="https://d2lvgg3v3hfg70.cloudfront.net/TB3817/.jpg" alt="FIGURE 2-6
Q18: FIGURE 2-12 <img src="https://d2lvgg3v3hfg70.cloudfront.net/TB3817/.jpg" alt="FIGURE 2-12
Q19: FIGURE 2-7 <img src="https://d2lvgg3v3hfg70.cloudfront.net/TB3817/.jpg" alt="FIGURE 2-7
Q21: FIGURE 2-9 <img src="https://d2lvgg3v3hfg70.cloudfront.net/TB3817/.jpg" alt="FIGURE 2-9
Q40: Suppose a ball is thrown straight up,
Q50: The slope of a tangent line at
Q52: The slope of a line connecting two
Q100: The slope of a line connecting two