Multiple Choice
FIGURE 2-4 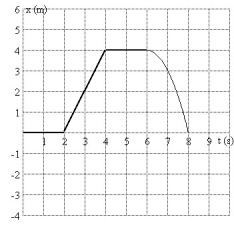
-A graph of position as a function of time is shown in Fig. 2-4. During which time interval could the object be possibly moving with non-zero constant acceleration?
A) 0.1 s to 1.9 s
B) 4.1 s to 5.9 s
C) 2.1 s to 3.9 s
D) 6.1 s to 7.9 s
E) There is no interval that is consistent with constant non-zero acceleration.
Correct Answer:

Verified
Correct Answer:
Verified
Q19: At a given instant, the acceleration of
Q34: If the position versus time graph of
Q83: Two objects are dropped from a bridge,
Q86: FIGURE 2-7 <img src="https://d2lvgg3v3hfg70.cloudfront.net/TB3817/.jpg" alt="FIGURE 2-7
Q92: A jet fighter plane is launched from
Q94: FIGURE 2-1 <img src="https://d2lvgg3v3hfg70.cloudfront.net/TB3817/.jpg" alt="FIGURE 2-1
Q95: FIGURE 2-10 <img src="https://d2lvgg3v3hfg70.cloudfront.net/TB3817/.jpg" alt="FIGURE 2-10
Q108: To determine the height of a flagpole,
Q109: When the velocity and acceleration of an
Q112: Which statement below about the distance between