Multiple Choice
FIGURE 2-5 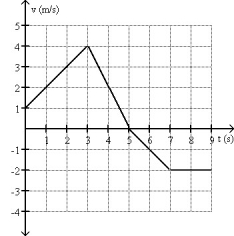
-A plot of position as a function of time is shown in Fig. 2-5. Which graph represents the acceleration as a function of time?
A) 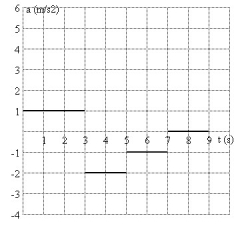
B) 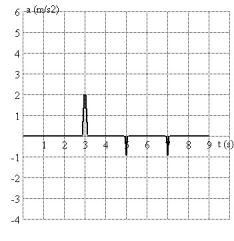
C) 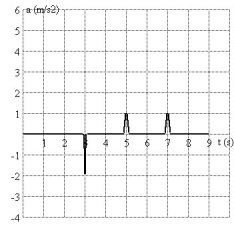
D) 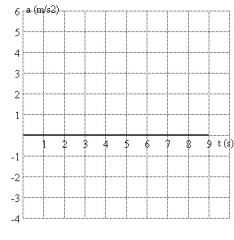
E) 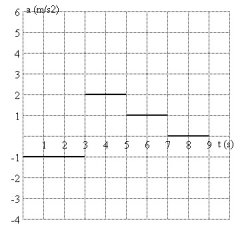
Correct Answer:

Verified
Correct Answer:
Verified
Related Questions
Q17: Car A is traveling at twice the
Q29: FIGURE 2-10 <img src="https://d2lvgg3v3hfg70.cloudfront.net/TB3817/.jpg" alt="FIGURE 2-10
Q30: The velocity of an object as a
Q34: Suppose that a car traveling to the
Q36: FIGURE 2-10 <img src="https://d2lvgg3v3hfg70.cloudfront.net/TB3817/.jpg" alt="FIGURE 2-10
Q37: An object is moving with constant non-zero
Q43: Which statement is correct about the relationship
Q46: The velocity of a particle as a
Q80: If a car accelerates at 4.0 m/s<sup>2</sup>,
Q89: At the instant a traffic light turns