Multiple Choice
Solve the problem.
-For the following table of data,
a. Draw a scatterplot.
B. Calculate the correlation coefficient.
C. Calculate the least squares line and graph it on the scatterplot.
D. Predict the y-value when x is 11. 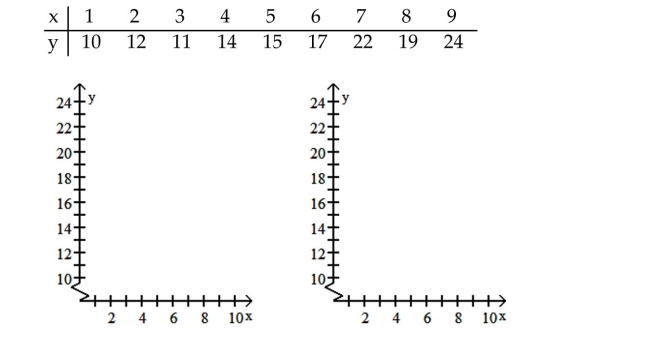
A) 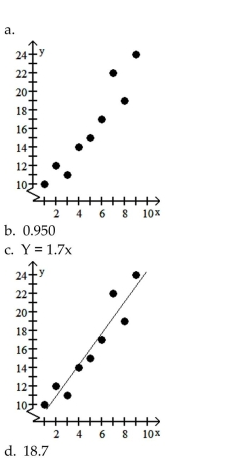
B) 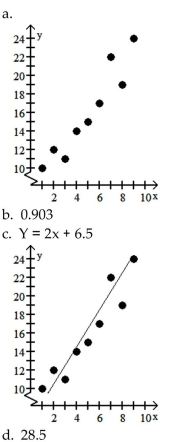
C) 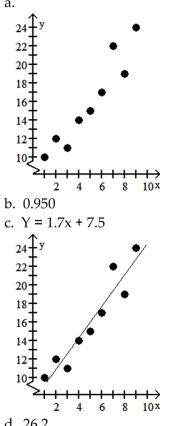
D) 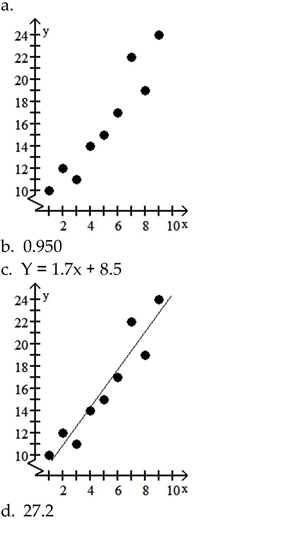
Correct Answer:

Verified
Correct Answer:
Verified
Related Questions
Q62: Find an equation in slope-intercept form
Q63: Graph the equation.<br>-y + 2 = 0
Q64: Suppose that the population of a certain
Q65: Find the correlation coefficient.<br>-The test scores
Q66: Find the slope of the line.<br>-The x-axis<br>A)0<br>B)-1<br>C)Not
Q68: Find the equation of the least
Q69: Write a cost function for
Q70: Solve the problem.<br>-The bank's temperature display shows
Q71: Solve the problem.<br>-A shoe company will make
Q72: The temperature of water in a certain