Multiple Choice
For the following table of data,
A. Draw a scatterplot.
B. Calculate the correlation coefficient.
C. Calculate the least squares line and graph it on the scatterplot.
D. Predict the y-value when x is -19. 
A) 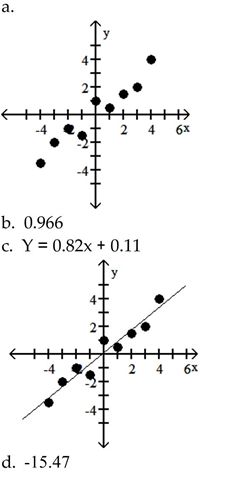
B) 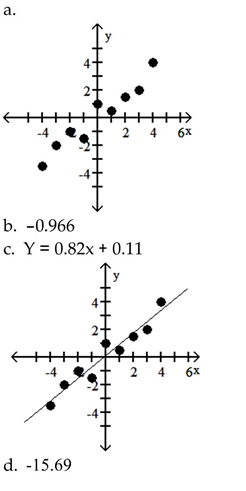
C) 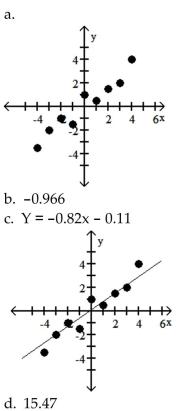
D) 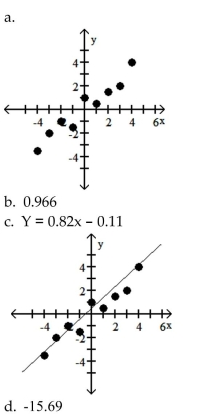
Correct Answer:

Verified
Correct Answer:
Verified
Related Questions
Q33: Solve the problem.<br>-For some reason the quality
Q34: Solve the problem.<br>-On a summer day, the
Q35: Solve the problem.<br>-The following are costs
Q36: Find an equation in slope-intercept form
Q37: Find the slope of the line.<br><img
Q39: Find the correlation coefficient.<br>-The following
Q40: If a company decides to make a
Q41: Find the slope of the line
Q42: Midtown Delivery Service delivers packages which cost
Q43: Find the slope of the line