Multiple Choice
Graph the equation.
-For the following table of data, a. Draw a scatterplot.
B. Calculate the correlation coefficient.
C. Calculate the least squares line and graph it on the scatterplot.
D. Predict the y-value when x is 20. 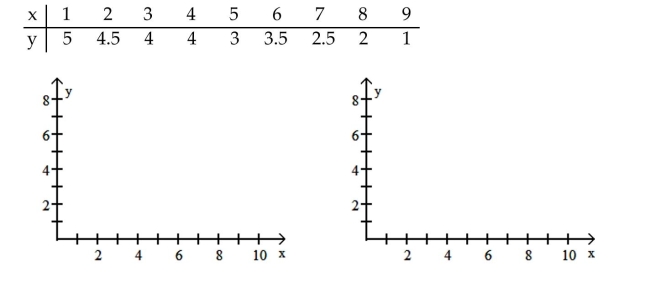
A) 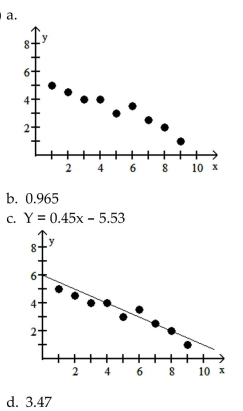
B) 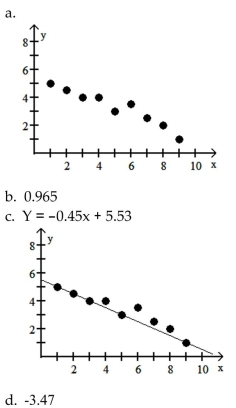
C) 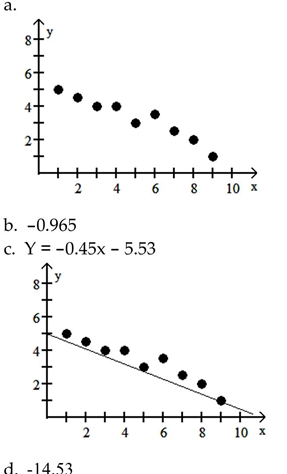
D) 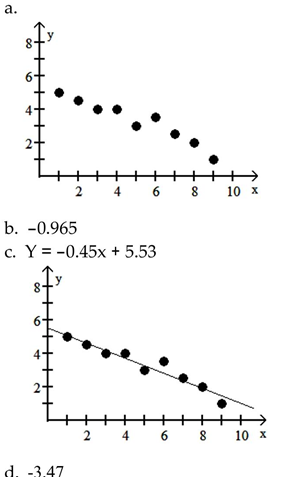
Correct Answer:

Verified
Correct Answer:
Verified
Q51: Find the correlation coefficient.<br>-Consider the data
Q52: Find the equation of the least
Q53: Find an equation in slope-intercept
Q54: Find the slope of the line. y
Q55: Find an equation in slope-intercept form
Q57: Let the demand and supply functions
Q58: Find the correlation coefficient.<br>-The following are
Q59: <img src="https://d2lvgg3v3hfg70.cloudfront.net/TB3081/.jpg" alt=" " class="answers-bank-image d-block" rel="preload"
Q60: Graph the equation.<br>-2y - 7x = 4
Q61: A book publisher found that the cost