Multiple Choice
Use Normal Probability Plots to Assess Normality
-Determine whether the following normal probability plot indicates that the sample data could have come from a population that is normally distributed. 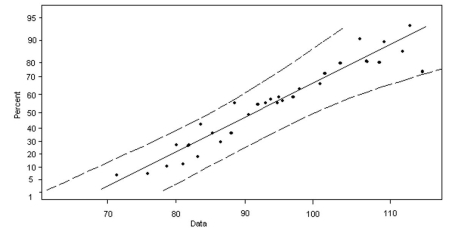
A) normally distributed
B) not normally distributed
Correct Answer:

Verified
Correct Answer:
Verified
Related Questions
Q53: A random variable X is normally
Q54: Interpret the Area under the Standard
Q55: Provide an appropriate response<br>-High temperatures in a
Q56: Find the Area under the Standard
Q57: Interpret the Area under the Standard
Q60: Find the Area under the Standard
Q62: State the Properties of the Normal
Q63: Explain the Role of Area in
Q68: If sample data are taken from a
Q89: Compare a graph of the normal density