Multiple Choice
Use Normal Probability Plots to Assess Normality
-Determine whether the following normal probability plot indicates that the sample data could have come from a population that is normally distributed. 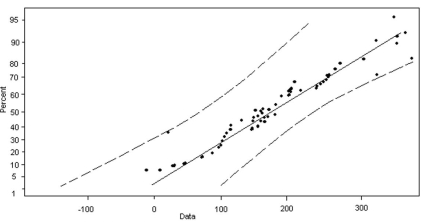
A) normally distributed
B) not normally distributed
Correct Answer:

Verified
Correct Answer:
Verified
Q95: A firm believes the internal rate of
Q101: Find the Value of a Normal Random
Q102: Use Normal Probability Plots to Assess Normality<br>-Determine
Q103: Approximate Binomial Probabilities Using the Normal Distribution<br>-A
Q104: Use Normal Probability Plots to Assess
Q105: Find and Interpret the Area under
Q107: Approximate Binomial Probabilities Using the Normal Distribution<br>-Find
Q108: A random variable X is normally
Q110: State the Properties of the Normal
Q111: Find and Interpret the Area under