Multiple Choice
Use Normal Probability Plots to Assess Normality
-Determine whether the following normal probability plot indicates that the sample data could have come from a population that is normally distributed. 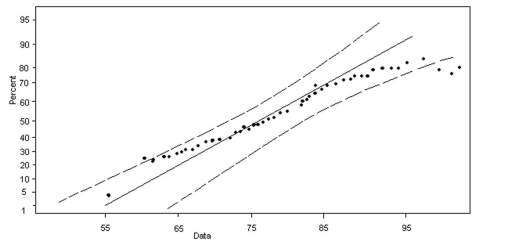
A) not normally distributed
B) normally distributed
Correct Answer:

Verified
Correct Answer:
Verified
Related Questions
Q60: Find the Area under the Standard
Q62: State the Properties of the Normal
Q63: Explain the Role of Area in
Q65: Find the Area under the Standard
Q66: Find the Area under the Standard Normal
Q67: Find the Value of a Normal Random
Q68: If sample data are taken from a
Q68: Explain the Role of Area in
Q69: Approximate Binomial Probabilities Using the Normal
Q89: Compare a graph of the normal density