Multiple Choice
Construct Probability Histograms
-Calculate the mean for the discrete probability distribution shown here.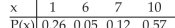
A)
B) 6
C) 24
D)
Correct Answer:

Verified
Correct Answer:
Verified
Related Questions
Q21: Determine Whether a Probability Experiment is a
Q22: Compute the Variance and Standard Deviation
Q23: Interpret the Mean of a Discrete
Q26: Determine Whether a Probability Experiment is a
Q27: Construct Probability Histograms<br>-A random number generator
Q28: Compute the Mean and Standard Deviation of
Q29: Interpret the Mean of a Discrete
Q77: A customer service firm receives an average
Q110: Classify the following random variable according to
Q123: Classify the following random variable according to