Multiple Choice
Choose the one alternative that best completes the statement or answers the question.
Make a scatter diagram for the data. Use the scatter diagram to describe how, if at all, the variables are related.
- 
A) 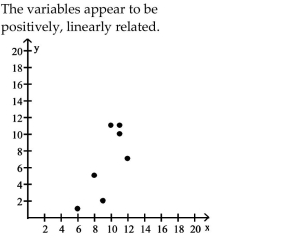
B) 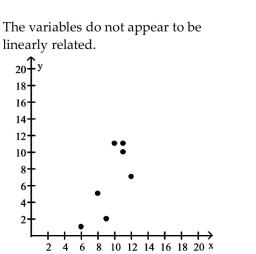
C) 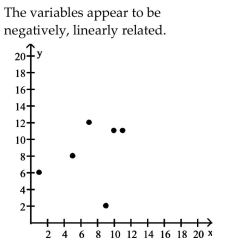
D) 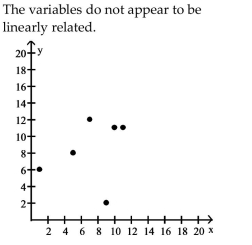
Correct Answer:

Verified
Correct Answer:
Verified
Related Questions
Q163: Write the word or phrase that
Q164: Interpret the Slope and the y-intercept
Q165: Find the Least-Squares Regression Line and
Q166: Write the word or phrase that
Q167: Choose the one alternative that best
Q169: Write the expression as a sum
Q170: Compute and Interpret the Coefficient of
Q171: Write the word or phrase that
Q172: Provide an appropriate response.<br>-Calculate the linear
Q173: Choose the one alternative that best