Multiple Choice
The scatter diagram shows the relationship between average number of years of education and births per woman ofchild bearing age in selected countries. Use the scatter plot to determine whether the statement is true or false.
-There is a strong positive correlation between years of education and births per woman. 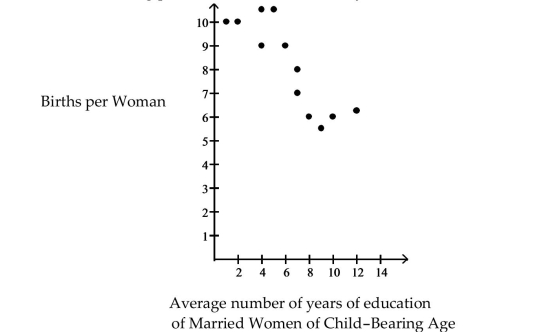
A) False
B) True
Correct Answer:

Verified
Correct Answer:
Verified
Q110: Compute the Sum of Squared Residuals<br>-The
Q111: Change the exponential expression to an
Q112: Choose the one alternative that best
Q113: Provide an appropriate response.<br>-In an area
Q114: Choose the one alternative that best
Q116: Find the Least-Squares Regression Line and
Q117: Write the expression as a sum
Q118: Perform Residual Analysis on a Regression Model<br>-To
Q119: Choose the one alternative that best completes
Q120: Find the Least-Squares Regression Line and