Multiple Choice
The scatter diagram shows the relationship between average number of years of education and births per woman ofchild bearing age in selected countries. Use the scatter plot to determine whether the statement is true or false.
-There is no correlation between years of education and births per woman. 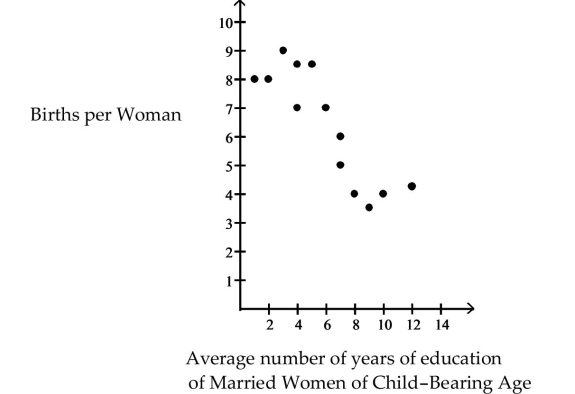
A) False
B) True
Correct Answer:

Verified
Correct Answer:
Verified
Q38: Calculate the coefficient of determination, given that
Q76: Provide an appropriate response.<br>-The data below
Q77: Compute the Sum of Squared Residuals<br>-In
Q78: Write the expression as a sum
Q79: Find the Least-Squares Regression Line and
Q80: Find the Least-Squares Regression Line and
Q82: Write the word or phrase that
Q83: Interpret the Slope and the y-intercept
Q84: Perform Residual Analysis on a Regression Model<br>-<img
Q85: Compute the linear correlation coefficient between