Multiple Choice
Interpret the Slope and the y-intercept of the Least-Squares Regression Line
-Civil engineers often use the straight-line equation, , to model the relationship between the mean shear strength of masonry joints and precompression stress, . To test this theory, a series of stress tests were performed on solid bricks arranged in triplets and joined with mortar. The precompression stress was varied for each triplet and the ultimate shear load just before failure (called the shear strength) was recorded. The stress results for triplet tests is shown in the accompanying table followed by a SAS printout of the regression analysis.
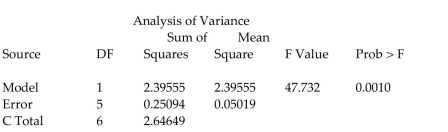
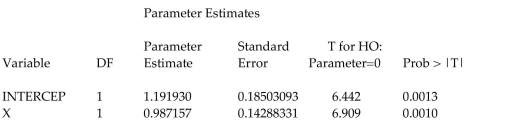
Give a practical interpretation of the estimate of the slope of the least squares line.
A) For every 1 ton increase in precompression stress, we estimate the shear strength of the joint to increase by ton.
B) For a triplet test with a precompression stress of 1 ton, we estimate the shear strength of the joint to be ton.
C) For every ton increase in precompression stress, we estimate the shear strength of the joint to increase by 1 ton.
D) For a triplet test with a precompression stress of 0 tons, we estimate the shear strength of the joint to be tons.
Correct Answer:

Verified
Correct Answer:
Verified
Q50: Calculate the coefficient of determination, given that
Q151: Provide an appropriate response.<br>-The data below
Q152: Change the exponential expression to an
Q153: Find the Least-Squares Regression Line and
Q154: Provide an appropriate response.<br>-The data below
Q155: Write the word or phrase that
Q157: Write the word or phrase that
Q159: Choose the one alternative that best
Q160: Perform Residual Analysis on a Regression Model<br>-<img
Q161: Provide an appropriate response.<br>-A manager wishes