Multiple Choice
Draw and Interpret Boxplots
-The boxplot shown below was constructed in Excel for the amount of soda that was poured by a filling machine into 12-ounce soda cans at a local bottling company. 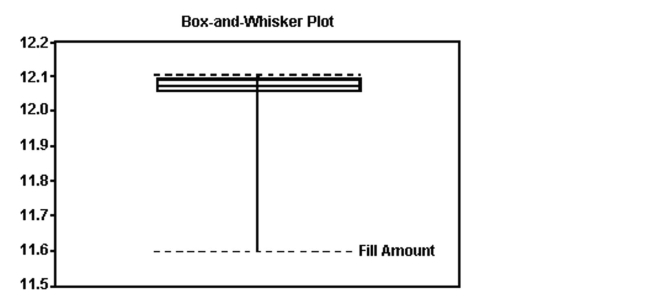 Based on the information given in the boxplot below, what shape do you believe the data to have
A) skewed to the left
B) approximately symmetric
C) skewed to the right
D) cannot be determined
Correct Answer:

Verified
Correct Answer:
Verified
Q69: Which is not a measure of dispersion?<br>A)
Q100: Determine and Interpret z-Scores<br>-Many firms use
Q101: Provide an appropriate response.<br>-A 1-pound bag
Q102: Provide an appropriate response.<br>-In a health
Q103: Provide an appropriate response.<br>-Each year advertisers
Q106: Use the Empirical Rule to Describe
Q107: Determine and Interpret z-Scores<br>-A television station
Q108: Use the Empirical Rule to Describe
Q109: Use Chebyshev s Inequality to Describe
Q110: Determine and Interpret z-Scores<br>-Find the z-score