Multiple Choice
Draw and Interpret Boxplots
-SAS was used to compare the high school dropout rates for the 50 states in 1982 and 1984. The box plots generated for these dropout rates are shown below. Compare the center of the distributions and the variation of the distributions for the two years. 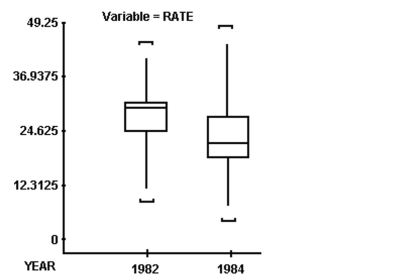
A) Dropout rates had a higher average with less variability in 1982 than in 1984.
B) Dropout rates had a higher average with more variability in 1982 than in 1984.
C) Dropout rates had a lower average with more variability in 1982 than in 1984.
D) Dropout rates had a lower average with less variability in 1982 than in 1984.
Correct Answer:

Verified
Correct Answer:
Verified
Q51: Which measure of central tendency may have
Q61: Compute the Range of a Variable
Q64: Provide an appropriate response.<br>-The grades are
Q65: Provide an appropriate response.<br>-For the following
Q67: Compute the Standard Deviation of a Variable
Q68: Use the Empirical Rule to Describe
Q69: Provide an appropriate response.<br>-If the graph
Q70: Provide an appropriate response.<br>-Describe the shape
Q71: Provide an appropriate response.<br>-A random sample
Q111: A highly selective boarding school will only