Short Answer
Use the graph to answer the question. 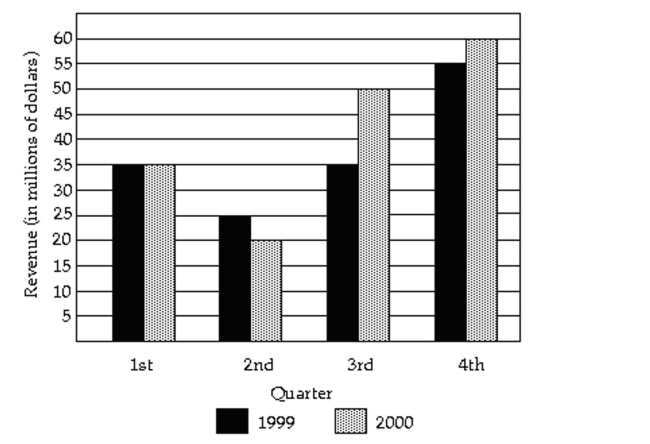
-Listed below are the ACT scores of 40 randomly selected students at a major university. a) Construct a relative frequency bar graph of the data, using eight classes. b) If the university wants to accept the top 90% of the applicants, what should the minimum score be c) If the university sets the minimum score at 17, what percent of the applicants will be accepted
Correct Answer:

Verified
a) See graph below
b...View Answer
Unlock this answer now
Get Access to more Verified Answers free of charge
Correct Answer:
Verified
b...
View Answer
Unlock this answer now
Get Access to more Verified Answers free of charge
Q3: The class midpoint can be determined by
Q13: A frequency polygon always begins and ends
Q67: Construct Histograms of Continuous Data<br>-The 30
Q68: Draw Stem-and-Leaf Plots<br>-The March utility bills
Q70: Retailers are always interested in determining
Q71: The pie chart shows the percentage
Q72: Identify the Shape of a Distribution<br>-The
Q74: Draw Stem-and-Leaf Plots<br>-For the stem-and-leaf plot
Q75: Draw Stem-and-Leaf Plots<br>-The numbers of runs
Q76: Construct Frequency Polygons<br>-The grade point averages