Multiple Choice
Solve the problem.
-The bar graph below shows a company's yearly profits from 2003 to 2011. Let an represent the company's profit, in millions, in year n, where n = 1 corresponds to 2003, n = 2 corresponds to 2004, and so on. 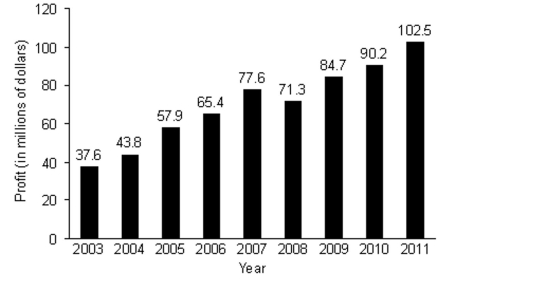
Find
A) million
B) million
C) \$544.6 million
D) million
Correct Answer:

Verified
Correct Answer:
Verified
Related Questions
Q37: Use the formula for the general
Q38: Write the first four terms of
Q39: Solve the problem.<br>-A new exhibit is scheduled
Q40: Express the sum using summation notation.
Q41: Write a formula for the general
Q43: Use the formula for the general term
Q44: Use the formula for the general term
Q45: Write the first four terms of
Q46: Use the formula for the sum
Q47: Write the first four terms of