Multiple Choice
The graph of a rational function, f, is shown in the figure. Use the graph to answer the question. 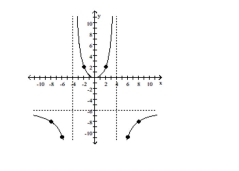
-How does the graph indicate that f(-4) does not exist?
A) There is a horizontal asymptote at x = -4 indicated by a dashed line.
B) There is a horizontal asymptote at y = -4 indicated by a dashed line.
C) There is a vertical asymptote at y = -4 indicated by a dashed line.
D) There is a vertical asymptote at x = -4 indicated by a dashed line.
Correct Answer:

Verified
Correct Answer:
Verified
Q27: The graph of a rational function, f,
Q28: Find the least common denominator of
Q29: Perform the indicated operations. Simplify the
Q30: Multiply as indicated.<br>- <span class="ql-formula" data-value="\frac
Q31: Simplify the rational expression. If the
Q33: Simplify the complex fraction.<br>- <span class="ql-formula"
Q34: Find the least common denominator of
Q35: Find the function value.<br>- <span class="ql-formula"
Q36: Divide as indicated.<br>- <span class="ql-formula" data-value="\frac
Q37: Find the least common denominator of