Multiple Choice
The figure shows the graphs of the cost and revenue functions for a company that manufactures and sells binoculars. Use the information in the figure to answer the question. 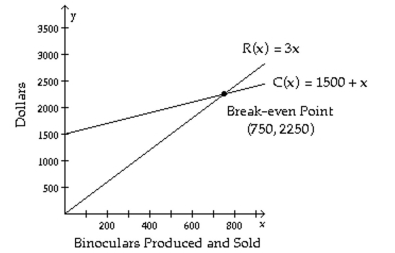
-More than how many binoculars must be produced and sold for the company to have a profit gain?
A) 2700 binoculars
B) 1500 binoculars
C) 750 binoculars
D) 2250 binoculars
Correct Answer:

Verified
Correct Answer:
Verified
Q17: The figure shows the graphs of the
Q18: Determine if the given ordered triple
Q19: Solve the system. If there is
Q20: Solve the problem.<br>-A couple have bought a
Q21: Solve the problem.<br>-Given the cost function,
Q23: Solve the system by graphing.<br>- <span
Q24: Determine whether the system is inconsistent,
Q25: Solve the system by any method.<br>-
Q26: Solve the system by the addition
Q27: Determine if the given ordered triple