Multiple Choice
The figure shows the graphs of the cost and revenue functions for a company that manufactures and sells binoculars. Use the information in the figure to answer the question. 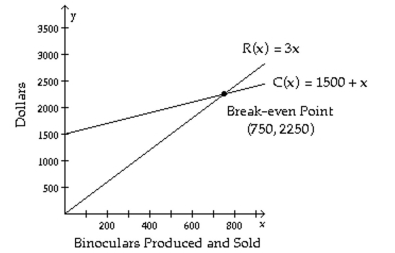
-What is the profit when 878 binoculars are produced?
A) $3256
B) $2012
C) $256
D) $5012
Correct Answer:

Verified
Correct Answer:
Verified
Q78: Solve the problem.<br>-An electronics company kept comparative
Q79: Determine whether the given ordered pair
Q80: Solve the problem.<br>-Given the cost function,
Q81: Determine whether the system is inconsistent,
Q82: Solve the system by the addition
Q84: Determine whether the given ordered pair
Q85: Solve the problem.<br>-A twin-engined aircraft can fly
Q86: Solve the problem.<br>-Jamil always throws loose change
Q87: Solve the system. If there is
Q88: Solve the system by any method.<br>-