Multiple Choice
The graph below shows the percentage of students enrolled in the College of Engineering at State University. Use the graph to answer the question. 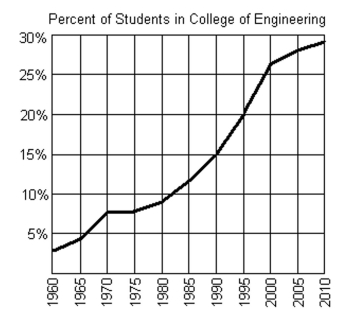
-If f(x) = 20%, what year is represented by x?
A) 2000
B) 1985
C) 1995
D) 1990
Correct Answer:

Verified
Correct Answer:
Verified
Related Questions
Q52: Use the vertical line test to determine
Q53: Use the graph to identify domain
Q54: Decide whether the relation is a function.<br>-Find
Q55: Use the vertical line test to determine
Q56: The graph below shows the percentage of
Q58: Find the slope of the line that
Q59: Graph the equation in the rectangular coordinate
Q60: Use the graph to find the
Q61: Find the slope of the line
Q62: Use the vertical line test to determine