Multiple Choice
The bar graph shows the expenditures of one city government in a recent year. 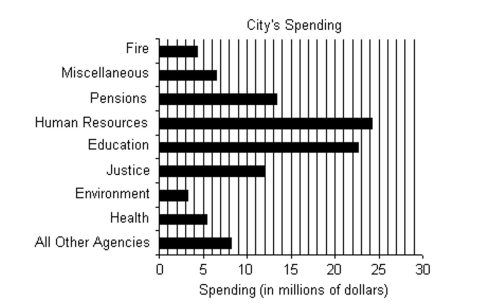
-How much more is spent on Pensions than on Health?
A) $6.4 million
B) $10.7 million
C) $8 million
D) $9.4 million
Correct Answer:

Verified
Correct Answer:
Verified
Related Questions
Q38: Evaluate the expression for the given values.<br>-3x
Q39: Match the correct viewing rectangle dimensions
Q40: Write the English phrase as an algebraic
Q41: Use the roster method to list the
Q42: Write the English phrase as an algebraic
Q44: <span class="ql-formula" data-value="- \frac { 3 }
Q45: Use the roster method to list the
Q46: Simplify the algebraic expression.<br>- <span class="ql-formula"
Q47: <span class="ql-formula" data-value="0 - ( - \sqrt
Q48: Simplify the algebraic expression.<br>-5(3x - 3) -