Multiple Choice
The line graph shows the recorded hourly temperatures in degrees Fahrenheit at an airport. 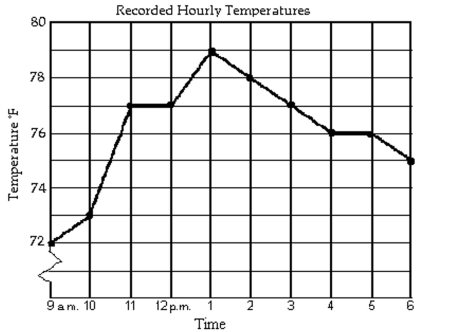
-At what time was the temperature the highest?
A) 11 a.m.
B) 2 p.m.
C) 5 p.m.
D) 1 p.m.
Correct Answer:

Verified
Correct Answer:
Verified
Q120: Graph the equation.<br>-<img src="https://d2lvgg3v3hfg70.cloudfront.net/TB6471/.jpg" alt="Graph the equation.
Q121: <span class="ql-formula" data-value="\frac { 1 } {
Q122: Evaluate.<br>- <span class="ql-formula" data-value="( - 4
Q123: The table of values was generated
Q124: Solve the equation.<br>-3x - 6 = 12<br>A)
Q126: Simplify the algebraic expression.<br>- <span class="ql-formula"
Q127: Find -x for the given value
Q128: Use the order of operations to
Q129: Express the interval in set builder
Q130: Evaluate the expression for the given values.<br>-3x