Multiple Choice
The line graph shows the recorded hourly temperatures in degrees Fahrenheit at an airport. 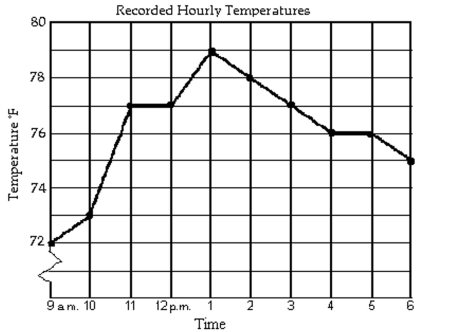
-During which two hour period did the temperature increase the most?
A) 10 a.m. to 12 p.m.
B) 9 a.m. to 11 a.m.
C) 12 p.m. to 2 p.m.
D) 10 a.m. to 11 a.m.
Correct Answer:

Verified
Correct Answer:
Verified
Q131: Graph the equation.<br>- <span class="ql-formula" data-value="y
Q132: Solve the problem.<br>-Jorge has a total of
Q133: Match the story with the correct figure.<br>-The
Q134: Solve the problem.<br>-The median age at
Q135: Determine whether the statement is true or
Q137: Determine whether the statement is true or
Q138: Express the interval in set builder
Q139: Solve the problem.<br>-If a ball is thrown
Q140: <img src="https://d2lvgg3v3hfg70.cloudfront.net/TB6471/.jpg" alt=" -14.7 + (-14.7)
Q141: Use the order of operations to simplify