Multiple Choice
From the TI-84 graphing calculator screenshots below, there are specific shaded areas that represent p-values. Choose the statement that best describes the interpretation of these p-values. 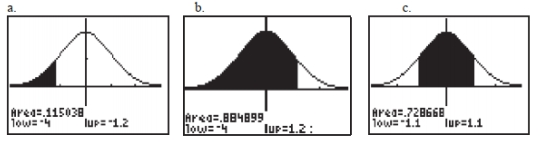
A) The p-values shown in graphics a and b display one-sided tests while c displays a shaded area showing a two-sided p-value.
B) The p-value shown in graphic c displays a one-sided test with a small p-value.
C) The p-value shown in graphic c displays a small two-sided p-value.
D) The p-value shown in graphic b displays a one-sided test with a small p-value.
Correct Answer:

Verified
Correct Answer:
Verified
Q47: A researcher wishes to test the claim
Q48: Which of the following is not one
Q49: [Objective: Understand the p-value] A quality control
Q50: A researcher believes that children who attend
Q51: [Objective: Test a hypothesis for a population
Q52: [Objective: Understand the hypothesis test of proportions
Q53: Use the following information to answer questions
Q54: [Objective: Understand the p-value] From the TI-84
Q56: [Objective: Interpret the z test statistic] Suppose
Q57: Two different students conduct a coin flipping