menu-iconExamlexExamLexServices

Discover

Ask a Question
  1. All Topics
  2. Topic
    Statistics
  3. Study Set
    Introductory Statistics Study Set 2
  4. Exam
    Exam 5: Modeling Variation With Probability
  5. Question
    The Venn Diagram Below Depicts Gender and Occupation of a Sample
Solved

The Venn Diagram Below Depicts Gender and Occupation of a Sample

Question 47

Question 47

Multiple Choice

The Venn diagram below depicts gender and occupation of a sample of adults. Which region on the Venn diagram represents the event "The individual is a male nurse"?
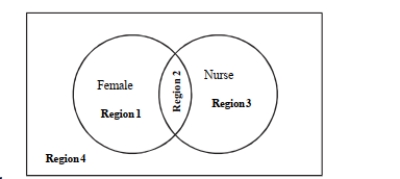
 The Venn diagram below depicts gender and occupation of a sample of adults. Which region on the Venn diagram represents the event  The individual is a male nurse ?   A) Region 1 B) Region 2 C) Region 3 D) Region 4


A) Region 1
B) Region 2
C) Region 3
D) Region 4

Correct Answer:

verifed

Verified

Unlock this answer now
Get Access to more Verified Answers free of charge

Related Questions

Q42: Suppose you would like a mug of

Q43: Use the following information to answer questions

Q44: Use the following table to answer questions

Q45: Use the following information to answer questions

Q46: If 20 babies are born, how often

Q48: A card player claims that the probability

Q49: Use the following information to answer questions

Q50: Use the following information to answer questions

Q51: Use the following information to answer questions

Q52: Use the following table to answer questions

Examlex

ExamLex

About UsContact UsPerks CenterHomeschoolingTest Prep

Work With Us

Campus RepresentativeInfluencers

Links

FaqPricingChrome Extension

Download The App

Get App StoreGet Google Play

Policies

Privacy PolicyTerms of ServiceHonor CodeCommunity Guidelines

Scan To Download

qr-code

Copyright © (2025) ExamLex LLC.

Privacy PolicyTerms Of ServiceHonor CodeCommunity Guidelines