Essay
The boxplots below represent critics' movie ratings (from 0 to 100) for movies that have been rated by the Motion Picture Association of America as R, PG-13, PG, and G. List the movie ratings according to their median critics' rating, from worst to best. 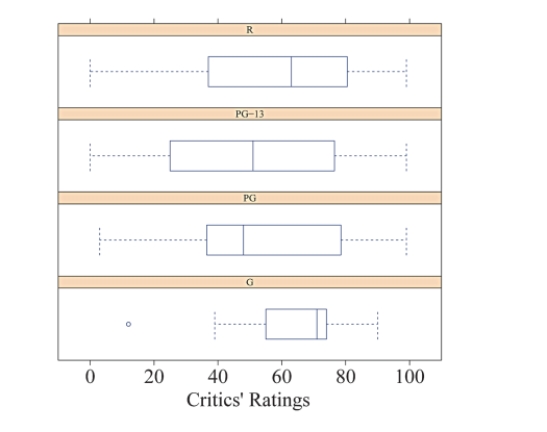
Correct Answer:

Verified
Correct Answer:
Verified
Related Questions
Q1: The number of students enrolled in a
Q3: Suppose we have a distribution of student
Q4: Use the following information for following questions
Q5: Use the following information for following questions
Q6: For the pair of histograms below, which
Q7: Which boxplot represents the same data as
Q8: [Be able to calculate the mean for
Q9: [Be able to calculate the mean for
Q10: Use the following information for following questions
Q11: Suppose we have a distribution of the