Multiple Choice
The following boxplot contains information about the length of time (in minutes) it took women participants to finish the marathon race at the 2012 London Olympics.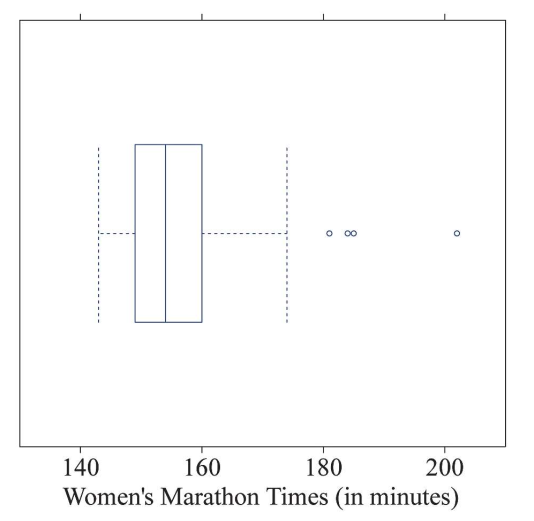
-What can be said about the shape of the distribution of men's running times for the marathon?
A) The distribution is symmetric.
B) The distribution is unimodal.
C) The distribution is left-skewed.
D) The distribution is right-skewed.
Correct Answer:

Verified
Correct Answer:
Verified
Q7: Which boxplot represents the same data as
Q8: [Be able to calculate the mean for
Q9: [Be able to calculate the mean for
Q10: Use the following information for following questions
Q11: Suppose we have a distribution of the
Q13: Two algebra classes at University High School
Q14: What do the dots on the right
Q15: The boxplots below represent movie runtimes (length
Q16: The fastest 25% of men participants ran
Q17: The number of dogs available at a