Multiple Choice
Which boxplot represents the same data as the histogram shown below? 
A) 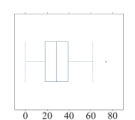
B) 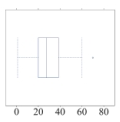
C) 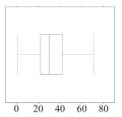
D) 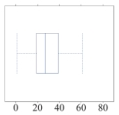
Correct Answer:

Verified
Correct Answer:
Verified
Related Questions
Q19: A class of 30 introductory statistics students
Q20: The mean can be thought of as
Q21: The following boxplot contains information about the
Q22: [Be able to calculate the mean for
Q23: For the pair of histograms below, determine
Q25: Two Geometry classes at North Hollywood High
Q26: Ten parents were asked the ages of
Q27: The five-number summary of the ages of
Q28: Use the following information for following questions
Q29: Ten parents were asked the ages of