Essay
Below are two histograms. One corresponds to the ages at which a sample of people applied for marriage licenses; the other corresponds to the last digit of a sample of social security numbers. Which graph is which, and why? 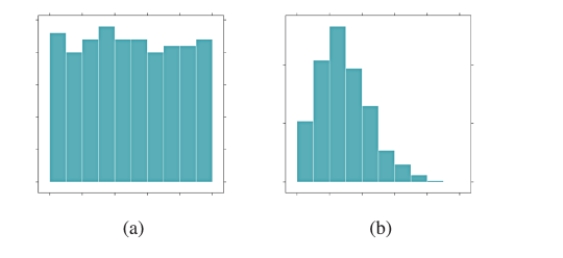
Correct Answer:

Verified
Histogram (a) displays the last digits o...View Answer
Unlock this answer now
Get Access to more Verified Answers free of charge
Correct Answer:
Verified
View Answer
Unlock this answer now
Get Access to more Verified Answers free of charge
Q36: Order the following histograms from least to
Q37: What is the difference between a histogram
Q38: Use the following information to answer questions
Q39: In the following histogram, what can you
Q40: Which statement below is NOT supported by
Q42: What is the typical value for the
Q43: According to the word cloud, what is
Q44: In the following histogram, what can you
Q45: What is the difference between a bar
Q46: The bar charts below depict the veteran