Essay
If you were to create a dotplot to display the same data that is represented in the following histogram, how many dots would you draw to represent heights that fall between 1.5 meters and 1.6 meters? 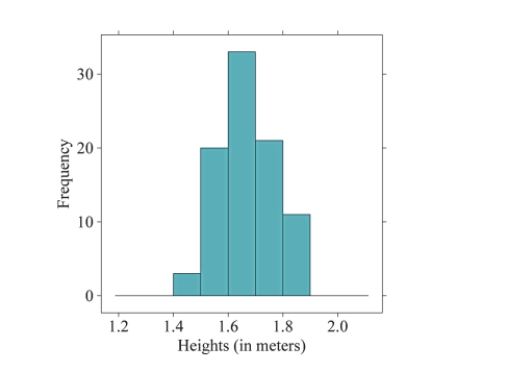
Correct Answer:

Verified
About 20 dots should be drawn ...View Answer
Unlock this answer now
Get Access to more Verified Answers free of charge
Correct Answer:
Verified
About 20 dots should be drawn ...
View Answer
Unlock this answer now
Get Access to more Verified Answers free of charge
Related Questions
Q6: The two histograms below display the exact
Q7: How is a dotplot similar to a
Q8: What information is NOT explicitly portrayed in
Q9: Order the following histograms from most to
Q10: What is the difference between a bar
Q12: What does it mean to find the
Q13: for following questions , what would you
Q14: for following questions , what would you
Q15: for following questions , match one of
Q16: Use the following information to answer questions