Multiple Choice
Consider the following chart. Which of the following statements is most correct? 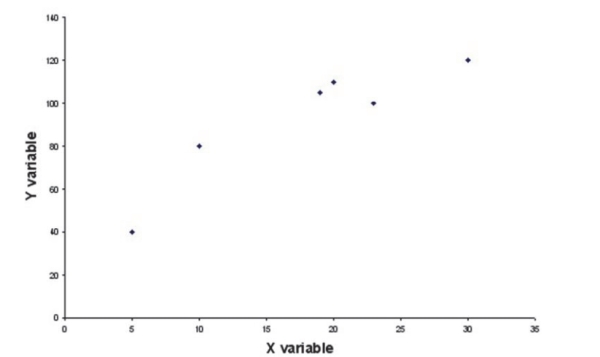
A) There is a negative linear relationship between the two variables.
B) There is a positive linear relationship between the two variables.
C) There is a perfect linear relationship between the two variables.
D) There is no apparent relationship between the two variables.
Correct Answer:

Verified
Correct Answer:
Verified
Q26: The undergraduate students at your university are
Q27: There is no hard-and-fast rule regarding the
Q28: A pie chart is almost always constructed
Q29: A stem and leaf diagram is most
Q30: A cumulative frequency distribution shows the percentage
Q32: A common rule of thumb for determining
Q33: Suppose you are given the following data.
Q34: Which of the following is an acceptable
Q35: If the Viking Sales Company plans to
Q36: Recently a survey was conducted in which