Multiple Choice
The Fitness Center manager has collected data on the number of visits to the club each week for the past 8 weeks. These data are shown as follows. Which of the following statements is most correct? 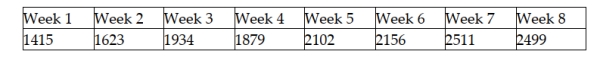
A) The proper graph for displaying these data is a pie chart.
B) There has been a gradual downward trend in these data.
C) A frequency histogram should be developed to help identify the trend in these data.
D) The data lend themselves to a line chart.
Correct Answer:

Verified
Correct Answer:
Verified
Q115: A histogram is most commonly used to
Q116: A study of 2000 Verizon cellphone customers
Q117: A bar chart is most likely used
Q118: In Excel, joint frequency distributions can be
Q119: The following class limits would be acceptable
Q121: If you wish to construct a graph
Q122: A bar chart possesses which of the
Q123: Suppose that you have a data set
Q124: Two separate frequency distributions for two variables
Q125: Frequency distributions can be formed from which